AI for CRE Executives – Instant Insights for Your Portfolio
Lobby AI combines decades of CRE expertise with cutting-edge industry-specific AI agents to help you optimize your portfolio.
Book Your Demo →Ask questions. Get answers.
Make decisions — in seconds, not weeks.
You already have the data.
We make it useful.
Your portfolio holds answers — about your loans, your strategy, your risks, your opportunities. But spreadsheets and fragmented systems don't give you insights.
Lobby AI does.
Private AI models
Ask any question — from loan analysis to investor reporting — and get instant, contextual answers.
Secure, siloed warehouse
Your data stays private. We don't co-mingle, and we don't train our models on your proprietary information.
Built-in financial models
Our AI leverages proprietary tools like interest rate forecasts, debt optimization logic, and more.
Monthly debt advisor calls
Get expert strategy alongside smart automation. Human + machine = better decisions.
Zero technical lift
We handle the setup, hosting, and maintenance. You just start asking questions.
See Lobby AI in Action.
Book a Personal Demo Today.
Book your 20-minute session to see how Lobby AI instantly answers portfolio-specific questions, generates in-depth risk analysis, composes investor-ready communications, and more.
Lobby AI is your capital markets copilot.
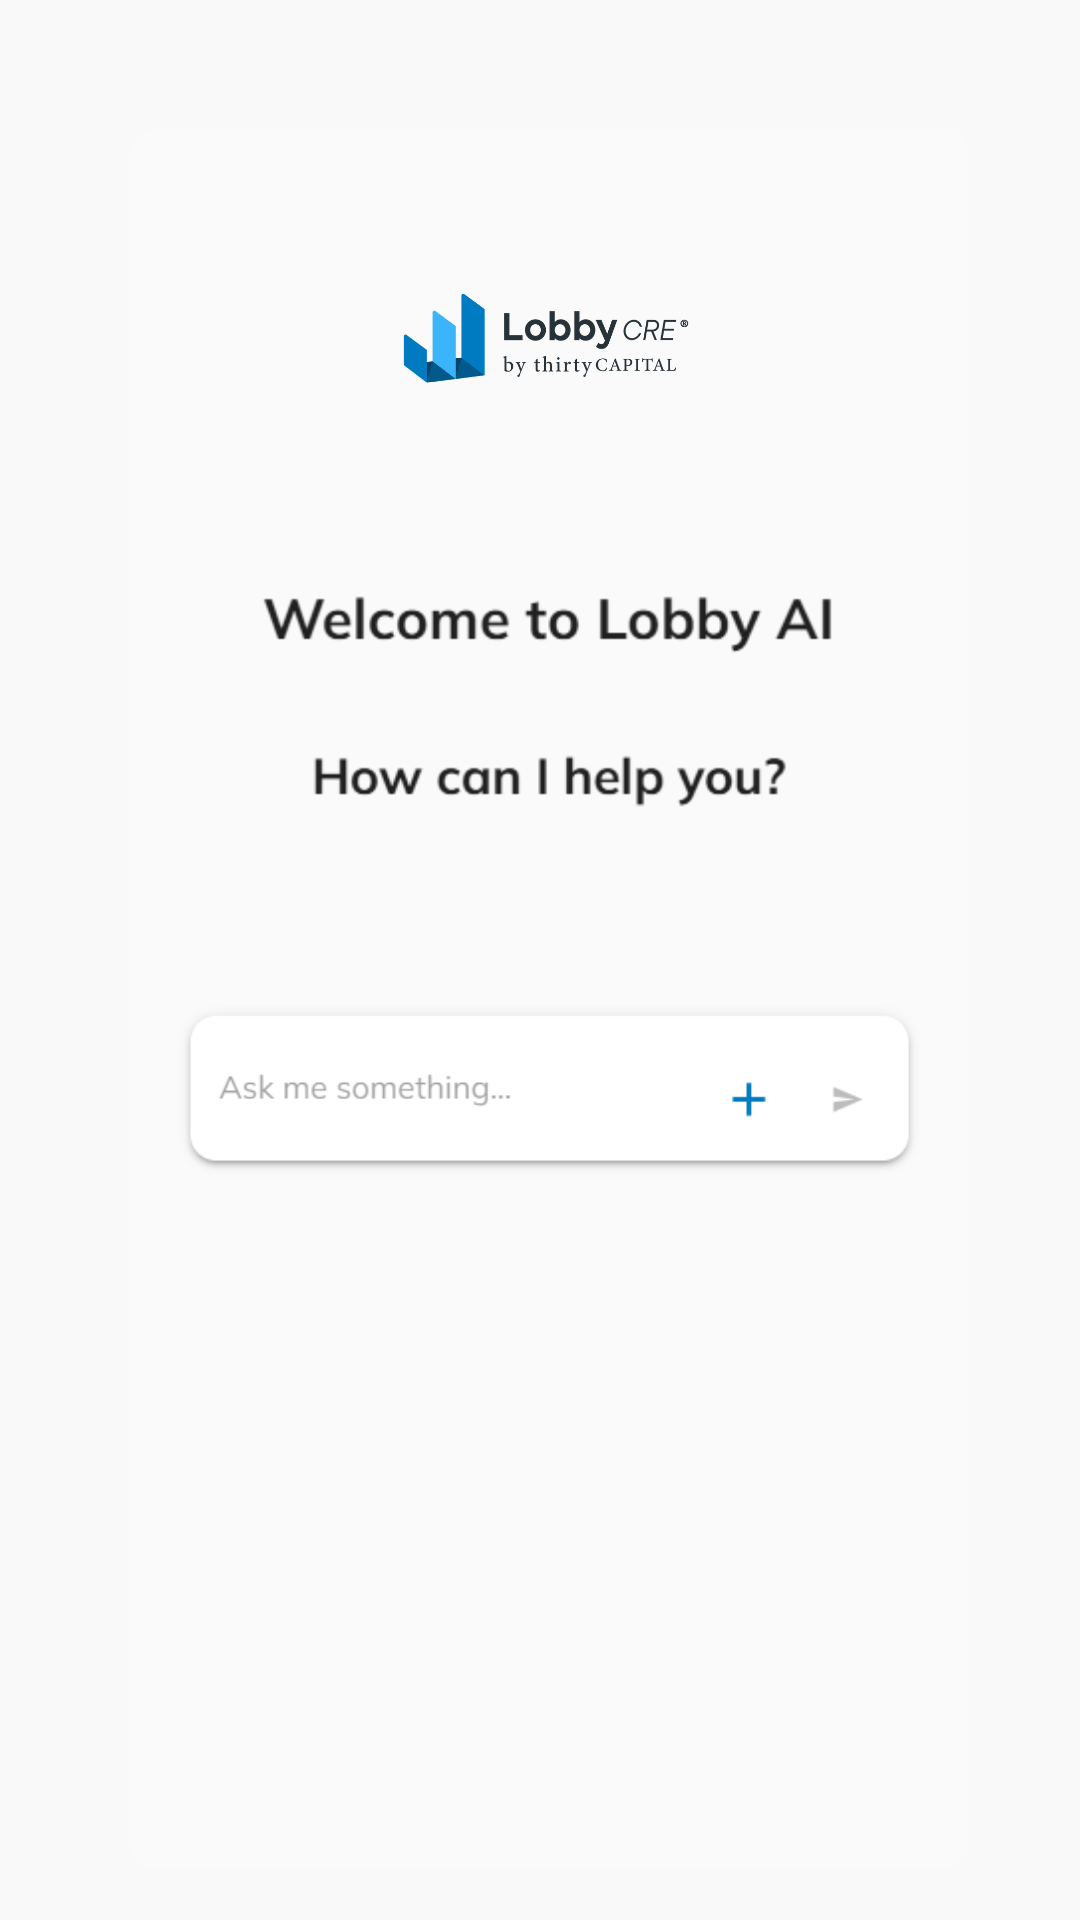
Lobby AI Mobile App: Built for CRE Leaders Who Don’t Wait

Commercial real estate doesn’t wait until you’re back at your desk. Decisions happen in hallways, on-site, over dinner, and between flights
With the Lobby AI Mobile App, your portfolio travels with you. Whether you’re analyzing debt exposure, reviewing property performance, or preparing for a lender meeting, you get insights in seconds – wherever you are.
Coming soon to the Google Play Store
The Lobby AI Advantage
| Lobby AI | Other Competitors | |
|---|---|---|
| Data Management | ✓ | ✗ |
| CRE-Specific Knowledge | ✓ | ✗ |
| Contextual, Actionable Insights | ✓ | ✗ |
| Private & Secure Data | ✓ | ✗ |
| Fully Managed Setup | ✓ | ✗ |
| CRE Expert Support | ✓ | ✗ |
| Portfolio Data Aggregation | ✓ | ✗ |
| Debt Advisor Access | ✓ | ✗ |
| No Data Used for Training | ✓ | ✗ |
AI for CRE Teams —Get Instant Insights & Strategies for Your Portfolio
Early adopter pricing currently available.
Lobby AI connects directly to your property data and delivers instant insights on everything from capital stack optimization to refinancing strategies. See how AI built specifically for CRE can accelerate your decision-making—and your returns.
From Data to Decisions – Instantly with Lobby AI.
See how Lobby AI transforms your portfolio data into real-time insights—automatically. No data prep. No modeling required. Just ask a question and get instant answers grounded in CRE logic and your actual numbers.
Why CRE Needs Purpose-Built AI
Tools like ChatGPT and Microsoft Copilot have transformed how professionals across industries access information and complete tasks. But when it comes to CRE, generic AI models often fall short.
Read MoreThe New Standard for Smart Debt Management
Purpose-built platforms like Lobby AI, is transforming how borrowers manage risk, seize opportunity, and plan for the next market turn. Here's how.
Read MoreHow AI is Reshaping CRE Portfolio Management
Discover how next-generation CRE-specific AI is reshaping CRE operations, finance, and strategy from the ground up.
Read More5 Ways AI Helps You Prepare for the Next Market Cycle
Learn about the five ways AI is helping CRE leaders get ahead of the next market cycle—before it arrives.
Read MoreFrequently Asked Questions
Everything you need to know about Lobby AI
- "Which loans in my portfolio are eligible for defeasance?"
- "What's the best strategy for optimizing my debt?"
- "Write a narrative summary for my investor report."
- "Analyze my current debt strategy and suggest changes."
- "We just closed Q2 — what should I be asking my property manager?"

